Uncategorized August 8, 2017

The Gardner Report | Western Washington Q2 2017
The Gardner Report  | Western Washington Q2 2017

The following analysis of the Western Washington real estate market is provided by Windermere Real Estate Chief Economist Matthew Gardner. We hope that this information may assist you with making better-informed real estate decisions. For further information about the housing market in your area, please don’t hesitate to contact me.

ECONOMIC OVERVIEW


The Washington State economy has been expanding at a rapid pace but we are seeing a slowdown as the state grows closer to full employment. Given the solid growth, I would expect to see income growth move markedly higher, though this has yet to materialize. I anticipate that we will see faster income growth in the second half of the year. I still believe that the state will add around 70,000 jobs in 2017.

Washington State, as well as the markets that make up Western Washington, continue to see unemployment fall. The latest state-wide report now shows a rate of 4.5%—the lowest rate since data started to be collected in 1976.

I believe that growth in the state will continue to outperform the U.S. as a whole and, with such robust expansion, I would not be surprised to see more people relocate here as they see Washington as a market that offers substantial opportunity.

HOME SALES ACTIVITY


  • There were 23,349 home sales during the second quarter of 2017. This is an increase of 1.1% from the same period in 2016.
  • Clallam County maintains its position as number one for sales growth over the past 12 months. Double-digit gains in sales were seen in just three other counties, which is a sharp drop from prior reports. I attribute this to inventory constraints rather than any tangible drop in demand. The only modest decline in sales last quarter was seen in Grays Harbor County.
  • The number of homes for sale, unfortunately, showed no improvement, with an average of just 9,279 listings in the quarter, a decline of 20.4% from the second quarter of 2016. Pending sales rose by 3.6% relative to the same quarter a year ago.
  • The key takeaway from this data is that it is unlikely we will see a significant increase in the number of homes for sale for the rest of 2017.
Annual Change in Home Sales

HOME PRICES


  • Along with the expanding economy, home prices continue to rise at very robust rates. Year-over-year, average prices rose 14.9%. The region’s average sales price is now $470,187.
  • Price growth in Western Washington continues to impress as competition for the limited number of homes for sale remains very strong. With little easing in supply, we anticipate that prices will continue to rise at above long-term averages.
  • When compared to the same period a year ago, price growth was most pronounced in San Juan County where sale prices were 29.2% higher than second quarter of 2016. Eight additional counties experienced double-digit price growth.
  • The specter of rising interest rates failed to materialize last quarter, but this actually functioned to get more would-be buyers off the fence and into the market. This led to even more demand which translated into rising home prices.
Western Washington Heat Map
Annual Change in Home Sale Prices

DAYS ON MARKET


  • The average number of days it took to sell a home in the quarter dropped by 18 days when compared to the same quarter of 2016.
  • King County remains the tightest market; homes, on average, sold in a remarkable 15 days. Every county in this report saw the length of time it took to sell a home drop from the same period a year ago.
  • Last quarter, it took an average of 48 days to sell a home. This is down from the 66 days it took in the second quarter of 2016.
  • Given the marked lack of inventory, I would not be surprised to see the length of time it takes to sell a home drop further before the end of the year.
Average Days on Market

CONCLUSIONS


Market Speedometer
This speedometer reflects the state of the region’s housing market using housing inventory, price gains, home sales, interest rates, and larger economic factors. For the second quarter of 2017, I moved the needle a little more in favor of sellers. To define the Western Washington market as “tight” is somewhat of an understatement. Inventory is short and buyers are plentiful. Something must give, but unless we see builders delivering substantially more units than they have been, it will remain staunchly a sellers’ market for the balance of the year. Furthermore, increasing mortgage rates have failed to materialize and, with employment and income growth on the rise, the regional housing market will continue to be very robust.

ABOUT MATTHEW GARDNER


Matthew Gardner is the Chief Economist for Windermere Real Estate, specializing in residential market analysis, commercial/industrial market analysis, financial analysis, and land use and regional economics. He is the former Principal of Gardner Economics, and has more than 30 years of professional experience both in the U.S. and U.K.
Uncategorized July 28, 2017

Blue Angels Practice & Show Schedule 2017

Uncategorized July 25, 2017

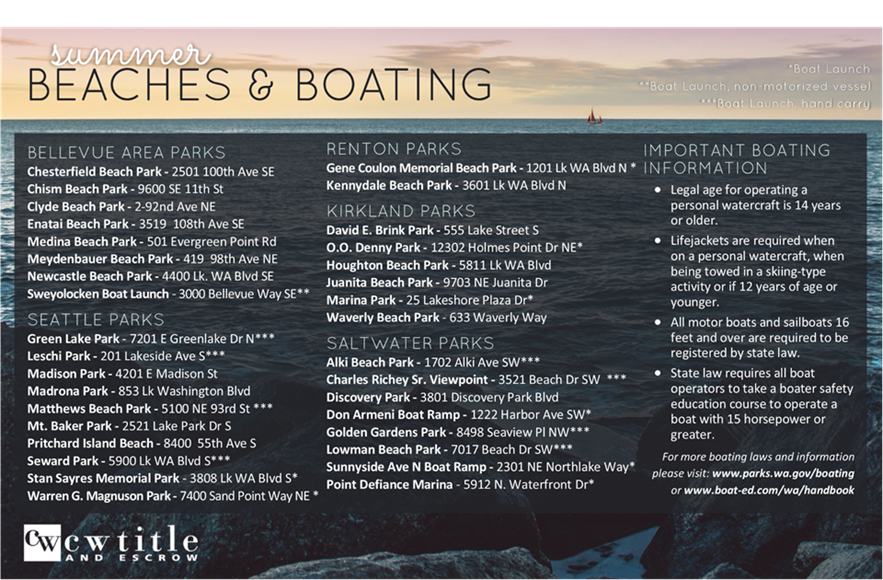
Summer Beaches & Boating

Uncategorized July 24, 2017

Vacation Home Security Checklist

Uncategorized July 19, 2017

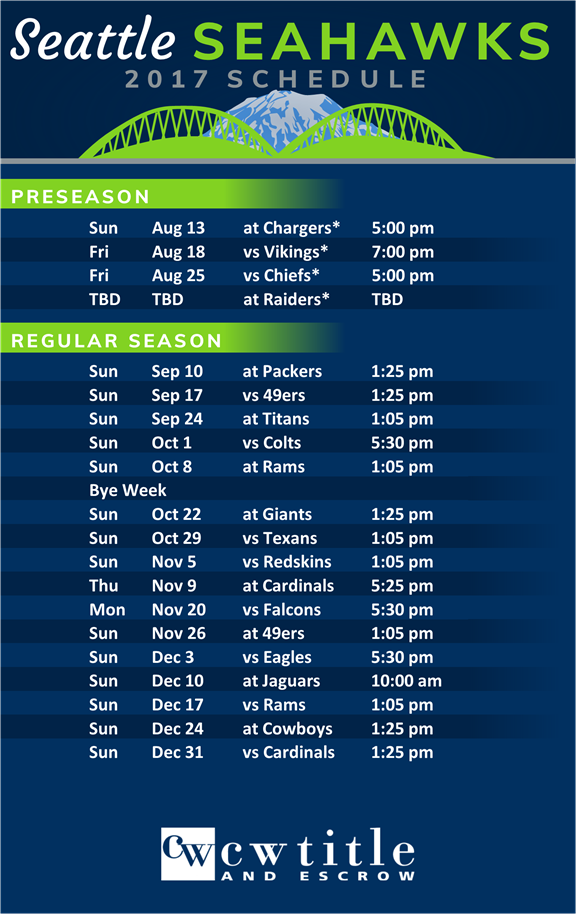
Seattle Seahawks 2017 Schedule

Uncategorized July 17, 2017

Windermere Foundation Report – Q2 2017

Dear Friends of the Windermere Foundation,Thanks to all of you, the Windermere Foundation collected over $903,500 in donations through the second quarter of 2017. This is an increase of 10 percent compared to this time last year! Individual contributions and fundraisers accounted for 62 percent of the donations, while 38 percent came from donations through Windermere agent commissions. So far, we have raised a total of $34,009,527 in donations since 1989.

Each Windermere office has its own Windermere Foundation fund account that they use to make donations to organizations in their communities. Year to date, a total of $979,486 has been disbursed to non-profit organizations dedicated to providing services to low-income and homeless families throughout the Western U.S.

One organization that has been the recipient of Windermere Foundation funds is the League of United Latin American Citizens (LULAC) National Scholarship Fund. LULAC has considered education its number one priority since it was established in 1929. The scholarship fund was established in 1975 to provide scholarships to help Hispanic youth in underserved communities make the dream of college enrollment a reality. Former recipients of LNSF scholarships are now leaders in fields of business, science, government, and education.  A rigorous selection process assures the expectation that future recipients will demonstrate the same level of excellence.

Last year, the Windermere office in Salinas, CA supported LULAC’s scholarship fund with a $1,000 donation, and will be making this donation annually. Christopher Barrera, Realtor and President of LULAC Salinas Council #2055, says “I am proud to be associated with such a great organization like Windermere Valley Properties in Salinas, and it’ll be an honor to present a check to LULAC on behalf of Windermere and the Windermere Foundation.” Each year, the LULAC Salinas Council holds a Black & White Ball to raise money for the scholarship fund. Monies raised are matched by LULAC national. There were 14 scholarships awarded in 2016. Thanks to the $15,000 raised through their event, matching funds from LULAC national, and a donation from the Windermere Foundation, they will be awarding 39 scholarships at a presentation ceremony on July 29 in Old Town Salinas.

Generous donations to the Windermere Foundation over the years have enabled Windermere offices to continue to support local non-profits like LULAC. If you’d like to help support programs for low-income and homeless families in your community, please click on the Donate button.


Gratefully,
Christine Wood
Executive Director
Windermere Foundation

Uncategorized July 11, 2017

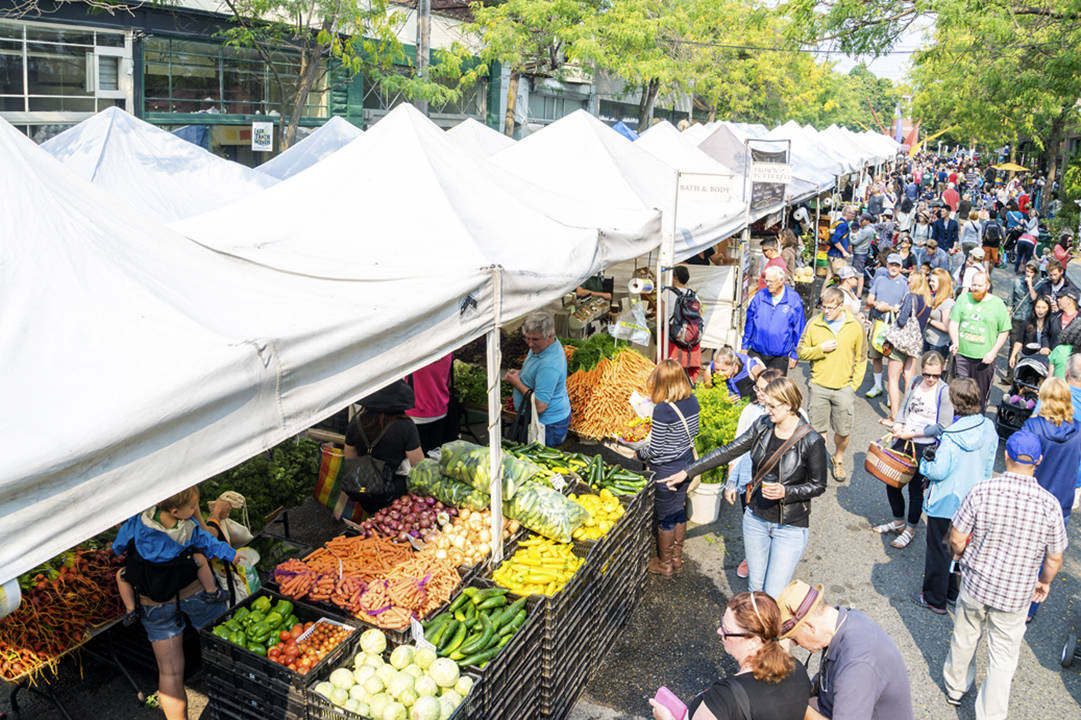
A Day-by-Day Guide to Seattle Farmers Markets
A Day-by-Day Guide to Seattle Farmers Markets

Where to get locally sourced food (almost) every day of the week.

Agatha Pacheco, Seattle Weekly, 6/7/17


Tuesday

City Hall PlazaGrabbing some produce after work won’t be that difficult here, at one of five markets run by Pike Place Market Express. Open now. 10 a.m.–2 p.m. 600 Fourth Ave.

Denny Regrade Market Located outside Amazon’s Doppler building, this formerly underdeveloped section of the city is booming thanks to tech—and hopefully its neighborhood farmers market. Open now. 10 a.m.–2 p.m. Seventh and Lenora.


Wednesday

Columbia City Located in the historical district next to a shady patch of grass, this market is ideal for those who enjoy mom-and-pop stores and local restaurant bites. Ends Oct. 11. 3–7 p.m. 37th Ave. S. & S. Edmunds St.

Pike Place Evening Market Though accessible year round, this classic market by the water has special summer evening hours. Enjoy a beautiful sunset and fresh local produce, even if only for one day a week. Open now. 3–7 p.m. Pike Place and Pine St.

 Wallingford Get an assortment of fresh fish, produce, ready-to-eat meals, and gifts at Meridian Park. Ends late Sept. 3:30–7 p.m. Meridian Ave. N. and N. 50th St.


Thursday

Lake City Hosting nearly 40 different artisan, and food vendors, this northeast Seattle market is a hit with the locals. June 8–Oct. 5, 3–7 p.m. N.E. 125th St. & 28th Ave. N.E.

South Lake Union Another Pike Place Market Express operation, this market features produce, flowers, artisan vendors, and more. Open now. 10 a.m.–2 p.m. 410 Terry Ave. N.

Queen Anne Unlike the others listed here, the Queen Anne farmers market is independently volunteer-run, and spans two whole blocks. Ends Oct. 12. 3–7:30 p.m. W. Crockett St. & Queen Anne Ave. N.


Friday

First Hill Like all farmers markets within Seattle, the First Hill one matches a $1 donation for every $10 spent with EBT through the Fresh Bucks program. Open now. 10 a.m.–2 p.m. Ninth Ave. and University St.

Madrona This market hosts more than 200 local vendors. Ends Sept. 29. 3–7 p.m. Martin Luther King Jr. Way & E. Union St.

Phinney Enjoy choosing from an array of local vendors, then take a short walk down to Greenlake for a quick swim. Ends Oct. 6. 3:30–7:30 p.m. N. 67th St. & Phinney Ave. N.


Saturday

Magnolia With a gorgeous view of Puget Sound, Magnolia’s market is a gem. Ends Oct. 14. 10 a.m.–2 p.m. (except July 29). 33rd Ave. W. & W. McGraw St.

U District Only a short walk from the UW campus and with plenty of shops around, there is a lot to do after you grab your goods.Year-round. 9 a.m.–2 p.m. University Way N.E. between N.E. 50th & N.E. 52nd Sts.


Sunday

Ballard Located on a cobblestone stretch, the Ballard market hosts over 200 different vendors. Year-round. 10 a.m.–3 p.m. 22nd Ave. N.W. and N.W. Market St.

Capitol Hill This market boasts artisanal foods, cheeses, vegetables, wines, beers, and ciders. Year-round. 11 a.m.–3 p.m. Broadway Ave. E. and E. Pine St.

Fremont This market has been going for 27 years, and it’s accrued a reputation for its European style. Year-round. 10 a.m.–4 p.m. 3410 Evanston Ave. N.

West SeattleLocated in West Seattle Junction, this market promises fresh produce from local Washington vendors. Year-round. 10 a.m.–2 p.m. California Ave. S.W. & S.W. Alaska St.

Uncategorized June 30, 2017

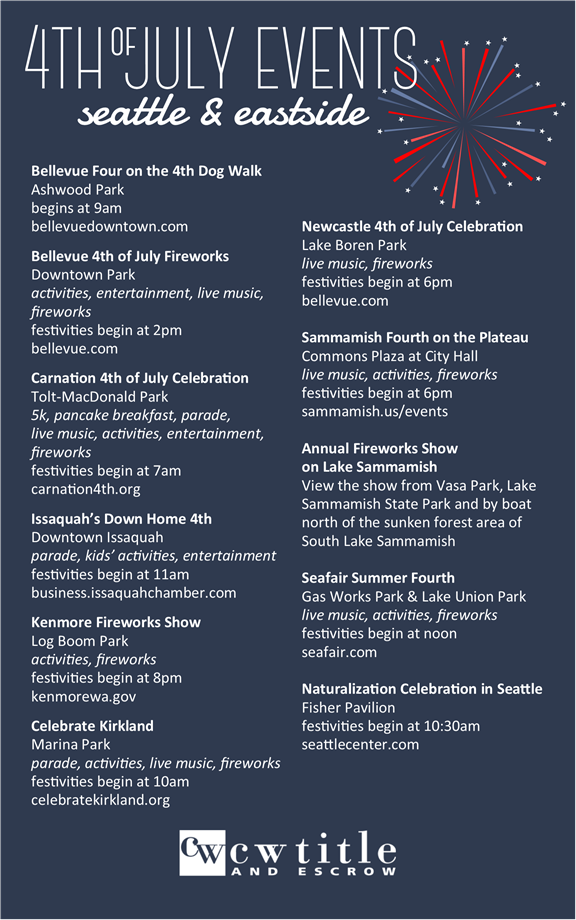
Seattle & Eastside 4th of July Events

Uncategorized June 30, 2017

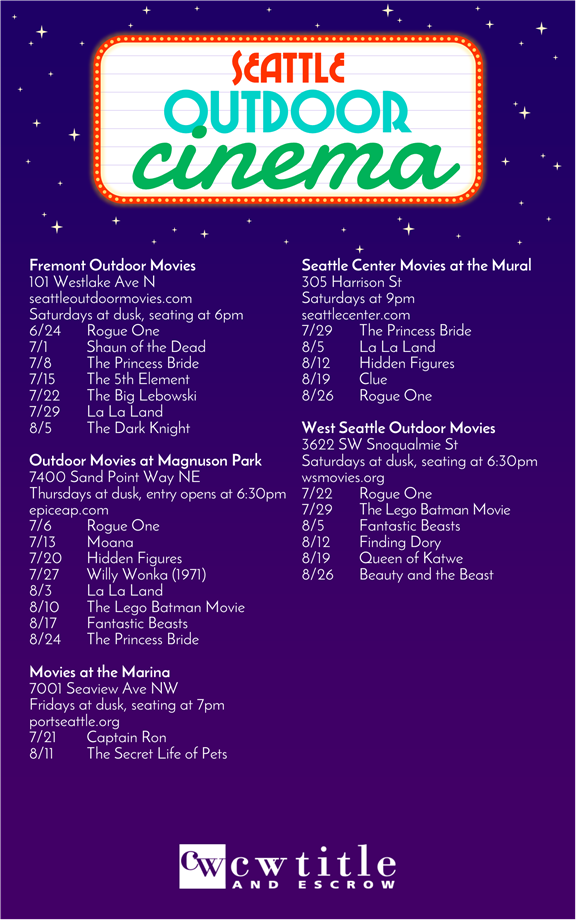
Seattle Outdoor Cinema

Uncategorized June 21, 2017

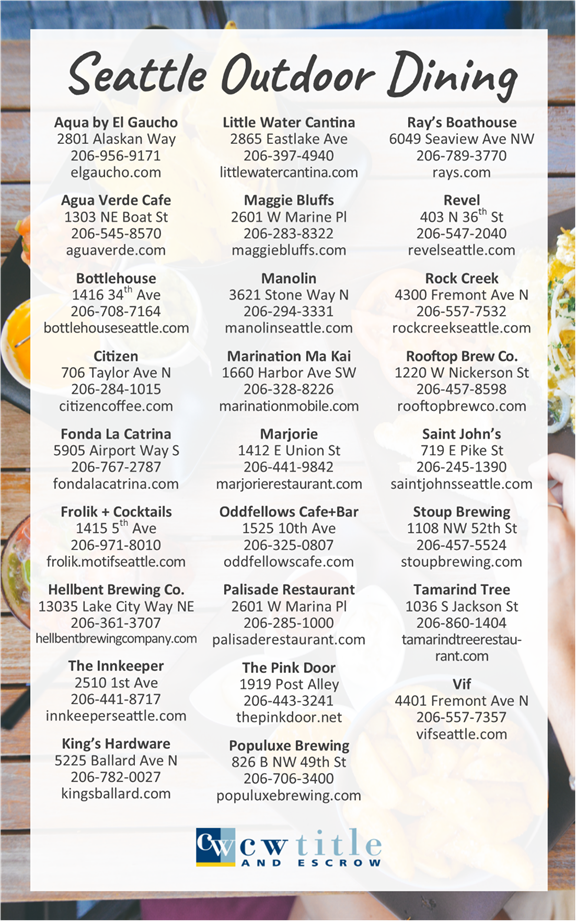
Seattle Outdoor Dining